Best Practices for Machine Learning
We have seen different algorithms in the last chapter and understood their significance as well. But before implementing Machine Learning for your “Business Objective”, we should suggest following the best practices used by the industry. These will help in avoiding any mistakes and ensure an error free implementation of Machine Learning.
We can identify the best practices for Machine Learning in the following manner:
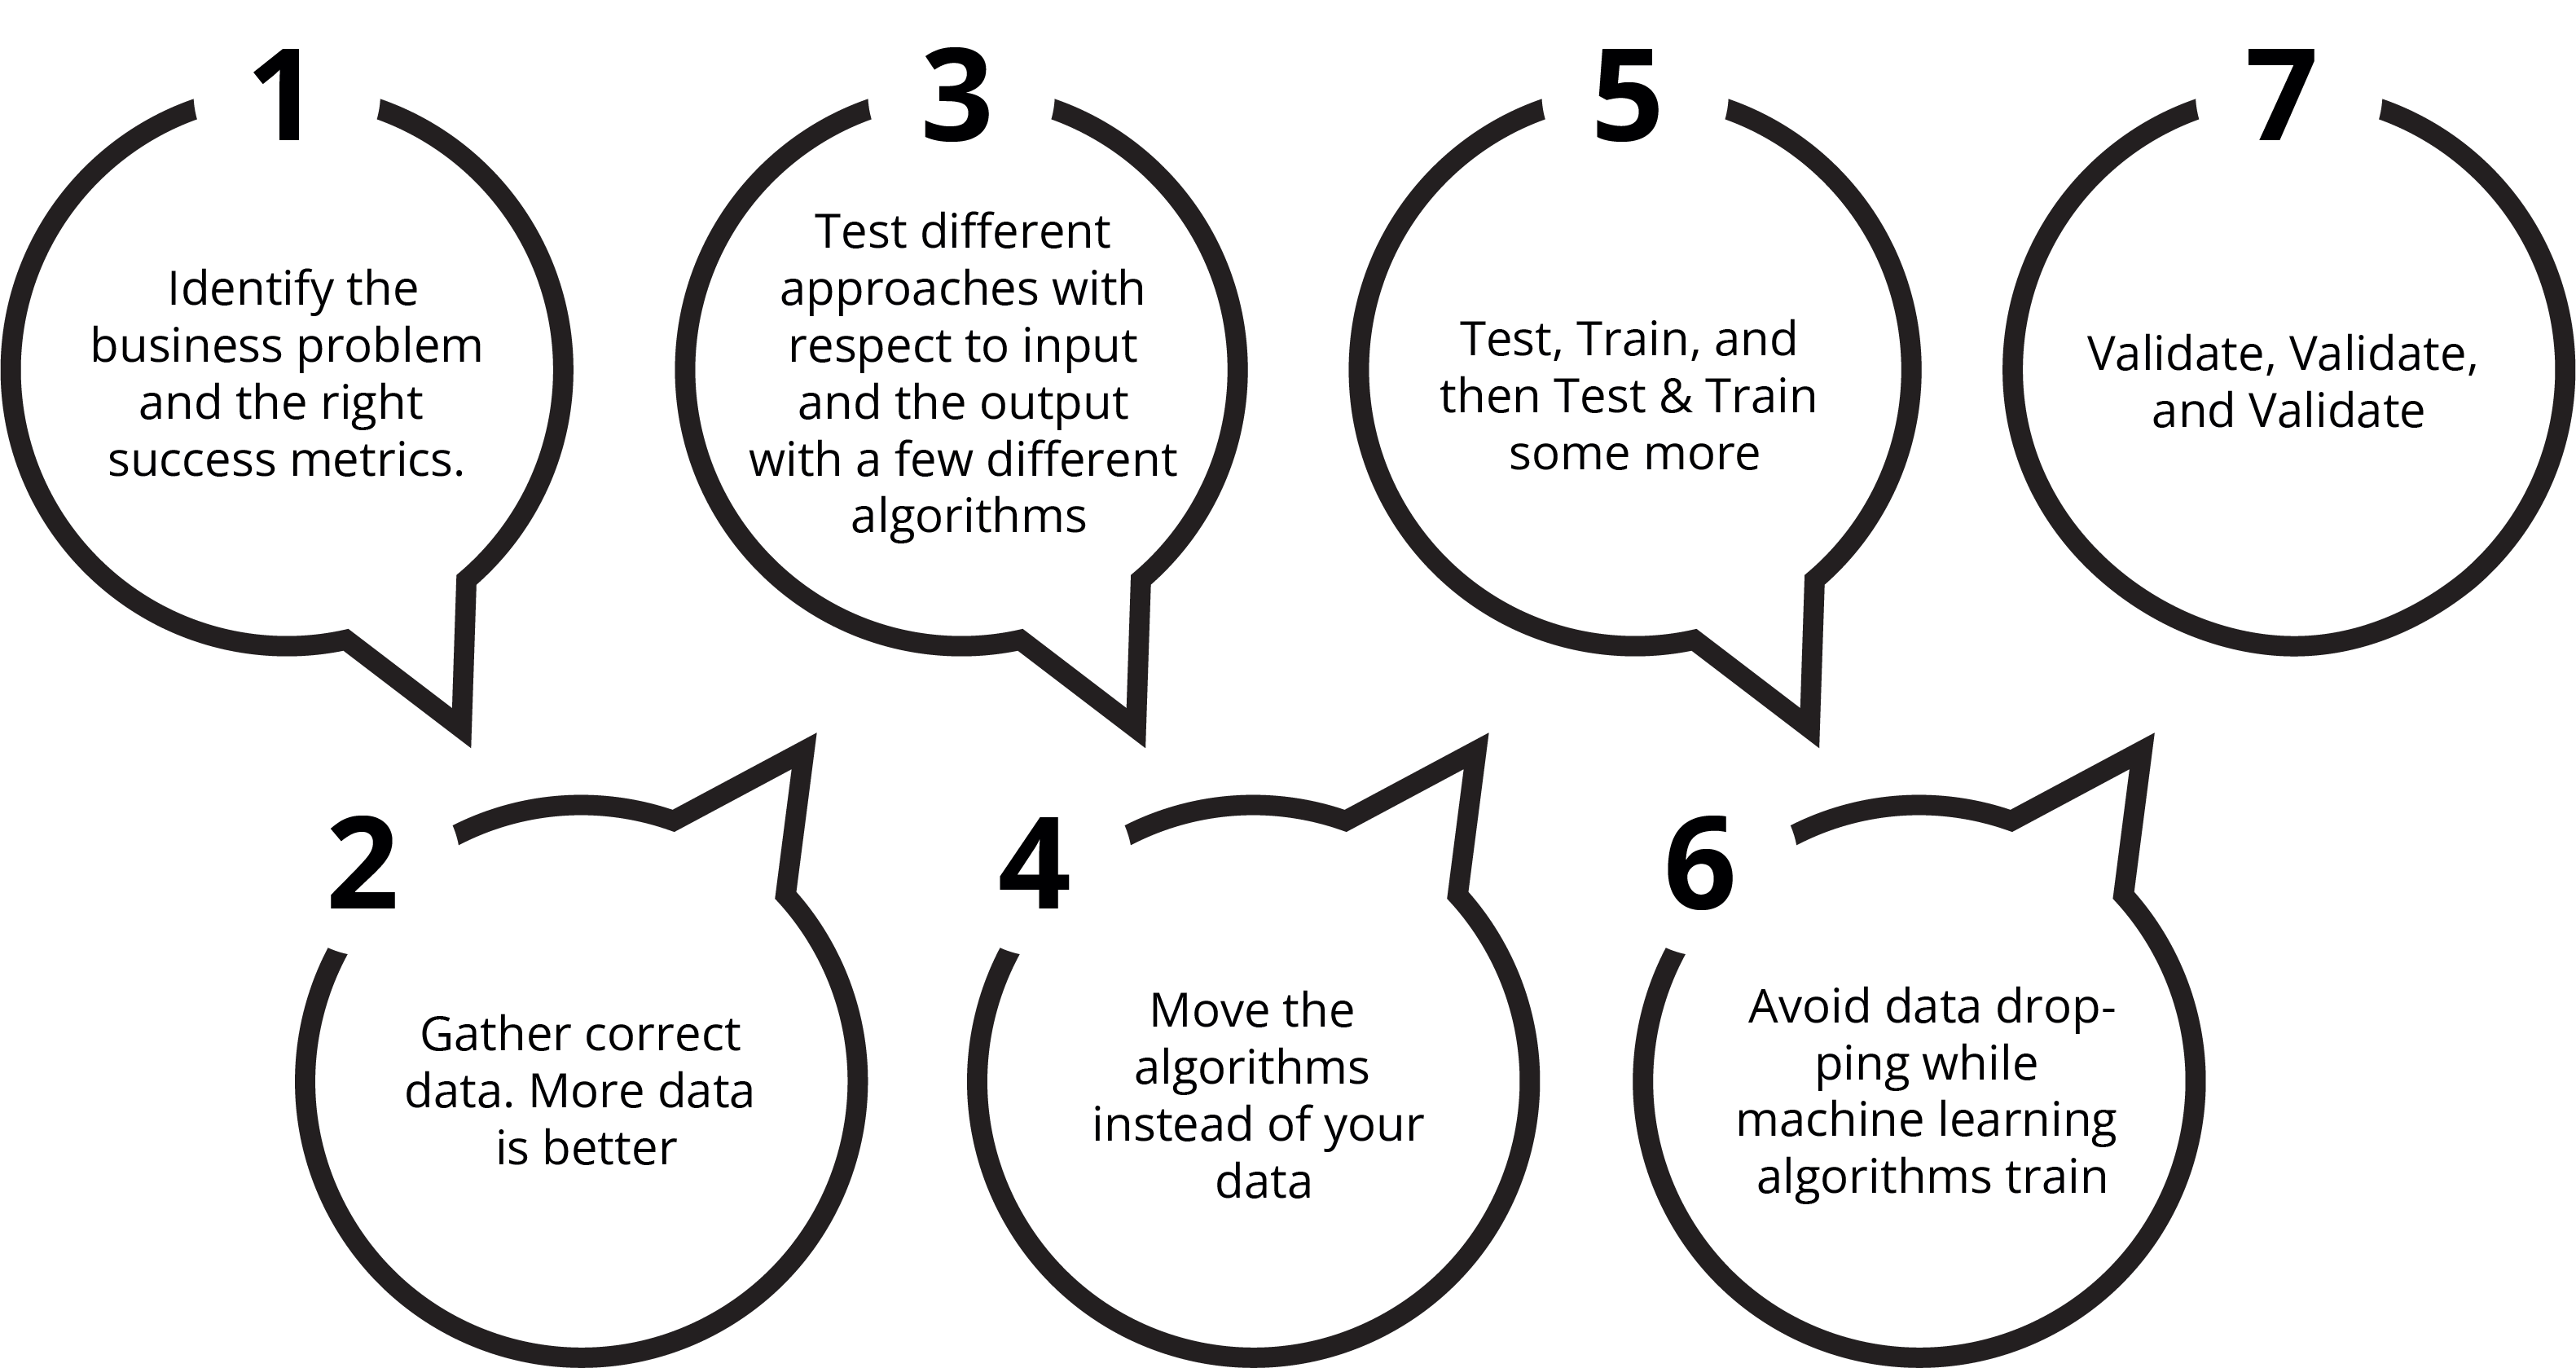
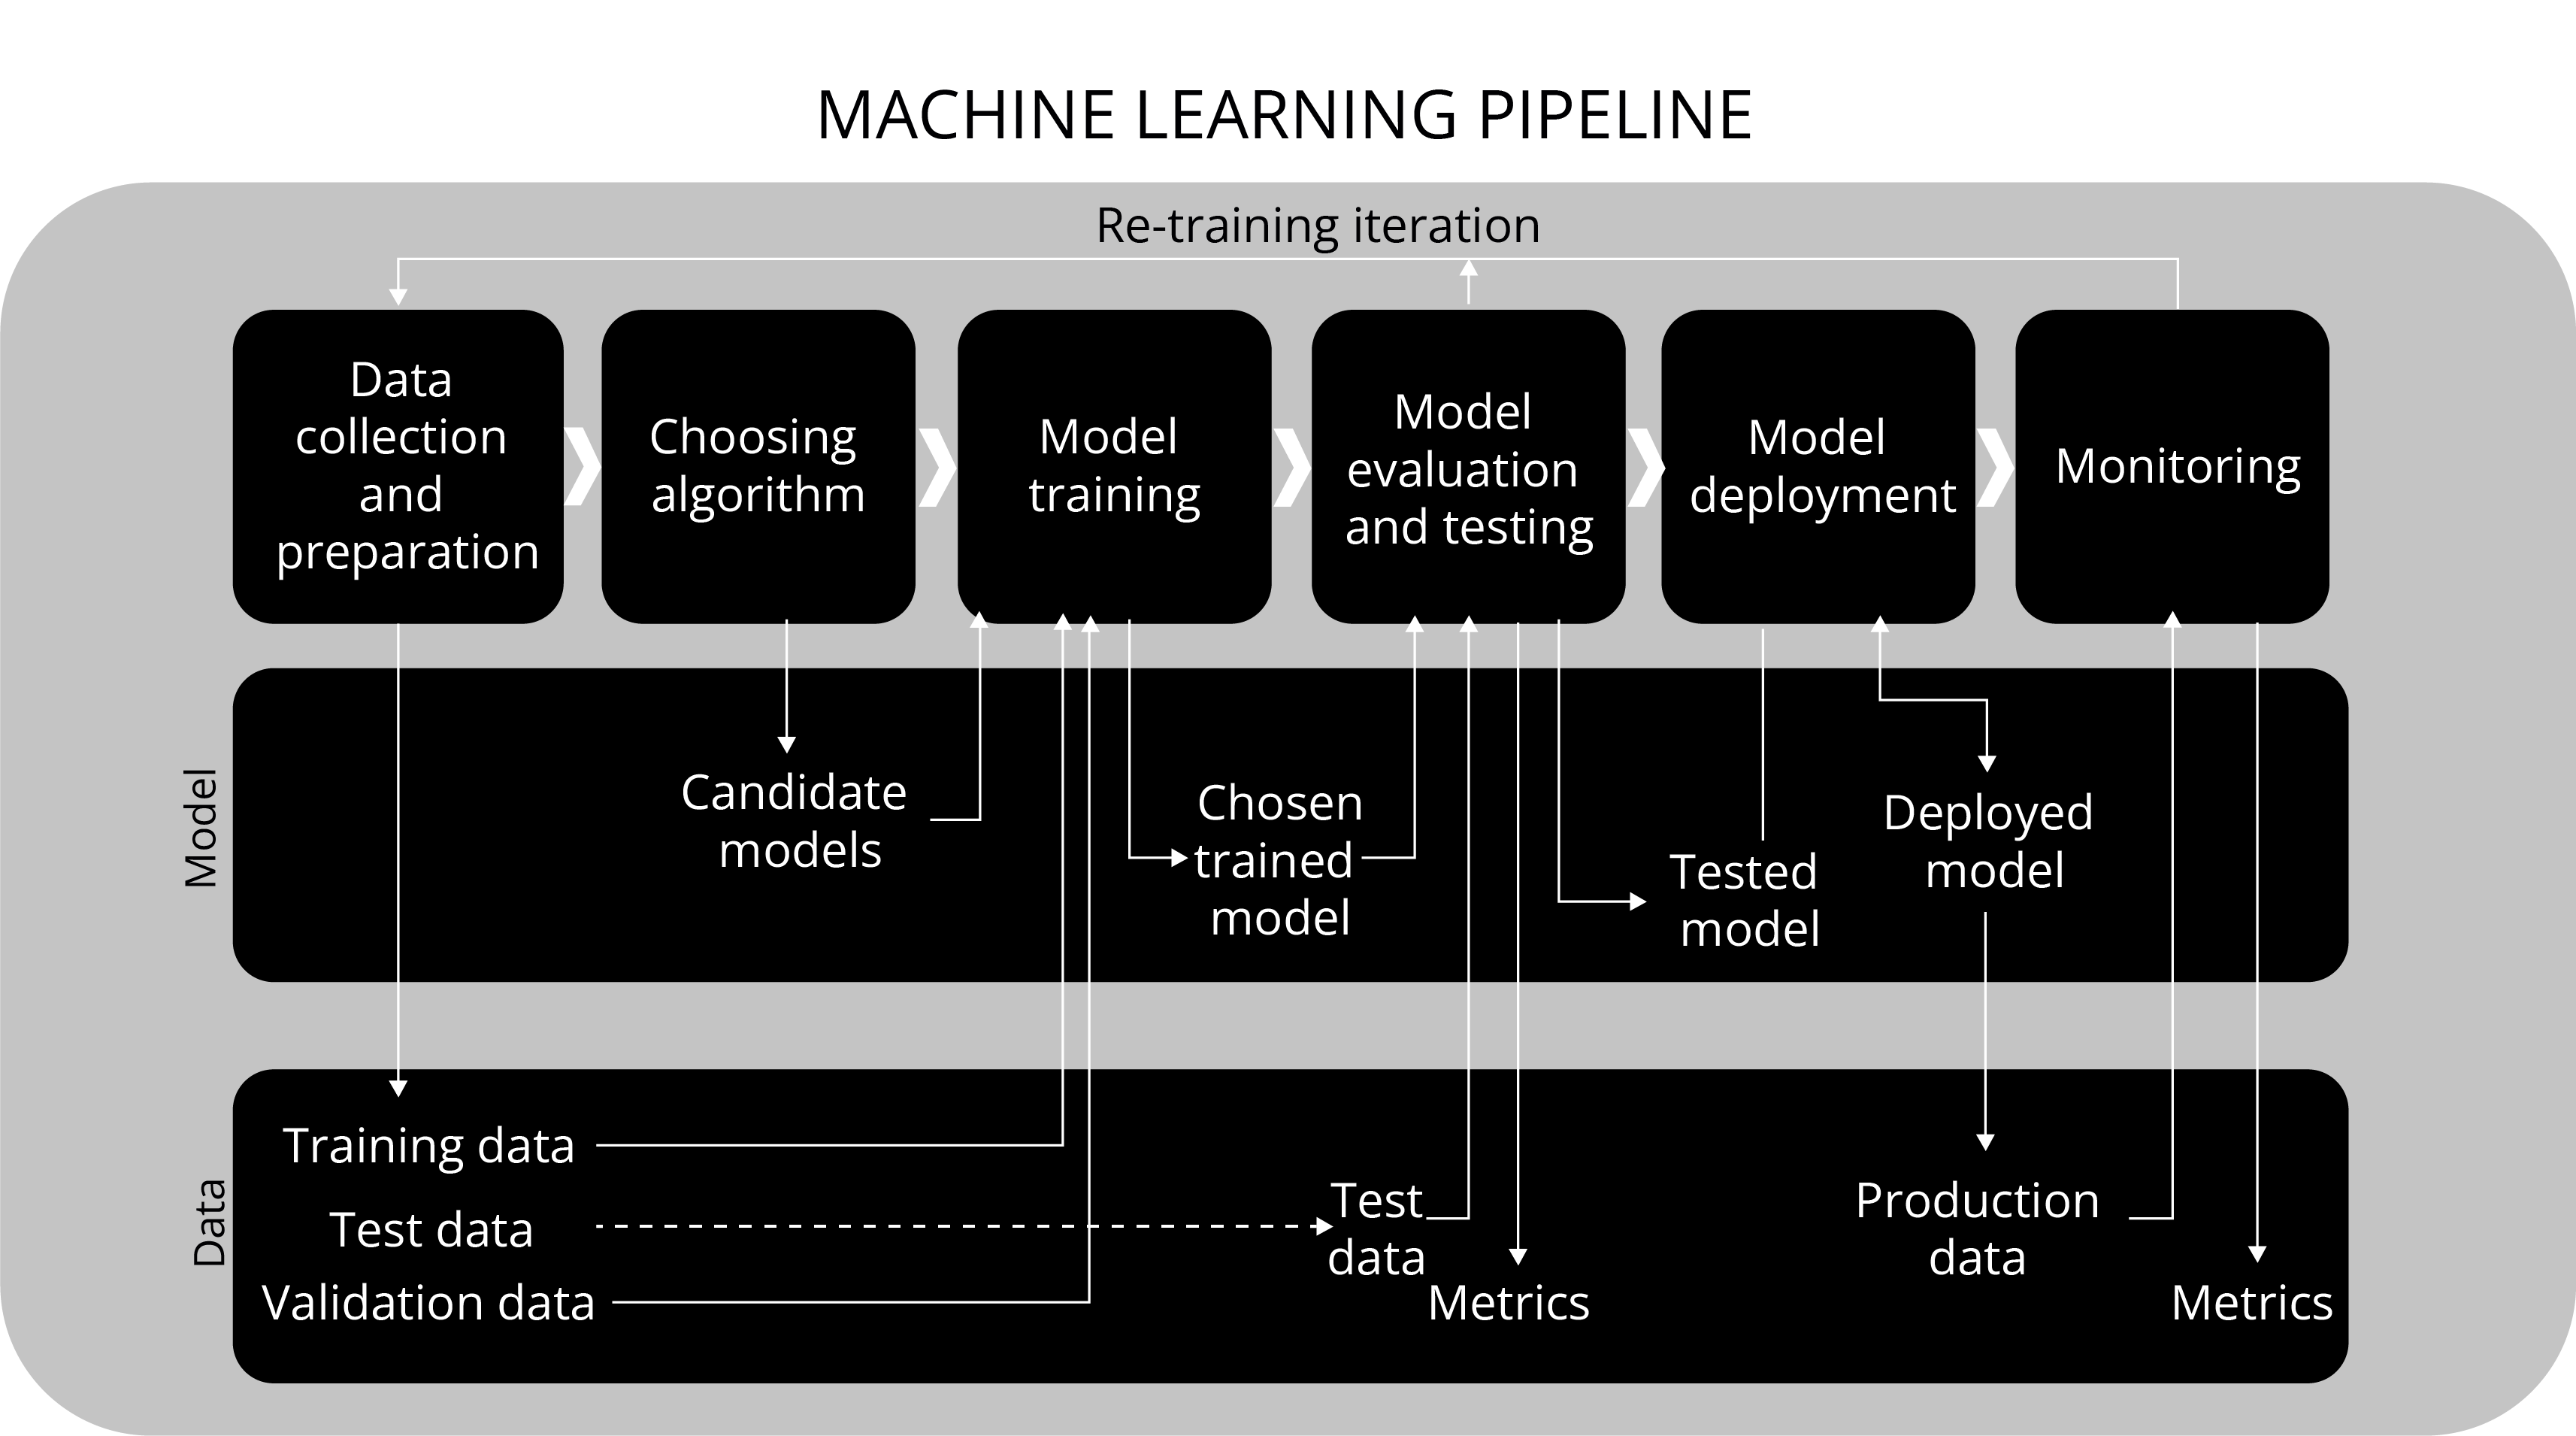
Most Machine Learning programs follow the above lifecycle. Machine Learning, like any other business capability, is primarily driven by a business problem. As a first activity, we have to convert this business problem into a Problem Statement and identify KPIs (Key Performance Indicator) to measure the outcome.
We need to make a list of relevant data points based on the Problem Statement and collect these data elements. The data points should be collected from trusted and reliable sources only. The data points should be labeled and understood. These are then tested individually and combined to create derived metrics to find the kernel of the input variables that have a significant impact on the outcome. The data science team also has to test different algorithms to determine their suitability for this exercise.
Once the team has a good grasp of the data elements and the algorithm to be used, they apply it at scale. It is preferably done on the database, especially for large databases so that this does not become a resource-intensive application.
The team further validates the algorithm by running it on various test data and unseen data. Data Scientists then fine-tune various parameters of the algorithm so that the algorithm is neither overfitted or under-fitted to the data set. The last step is to validate the algorithm by using it on new datasets.
1. Identify the business problem and the right success metrics.
The purpose of Machine Learning and AI in most cases is to make a prediction. In business-related use cases, Machine Learning and AI can be used for different purposes such as:
A. Predicting customer buying behaviors or pattern
B. Classifying an email is spam or not or any kind of image classification
C. Understanding customer sentiment towards our services/products
D. Is this customer going to attrite in the next X days
E. Will the viewer/visitor buy a specific service/product
The first step of ML (Machine Learning) implementation is to define a Business Problem statement and its corresponding KPI or columns. The Business Problem statements include the challenges that the organization is facing and they will be in text format. We need to identify a column that can be used to measure it. These columns are called KPIs.
It is important to note that the Business Problem and the KPIs are two different but related metrics:
Identify the Specific Business Problem to be Addressed

In the above image, we are depicting the customer retention challenges faced by the organization. As we have discussed, the first step is to identify Business Problem statements and KPI. Here it is.

Here the output variable is Low Customer Retention. And the variables that impact this outcome are the input variables. And like any decision that we make as individuals, there can be multiple input variables that impact our outcome decisions.
The order and importance of input variables may differ for different business problems.
We cannot measure the outcome of the algorithm just in terms of the prediction. As a business, the outcome should be measured relative to the current state.
The goal of a Machine Learning process should, therefore, be something along the lines of any one of the following:
Achieve an improvement of X% in our prediction rate
Achieve an improvement of X% in a specific metric versus control
Such numeric thresholds will help us determine if a Machine Learning experiment is successful or not. These metrics will also make it easier for businesses to figure out what the ROI of a Machine Learning project will be.
2. Gather correct data. Often (not always) more data is better.
Gathering correct data is the core of every machine learning business application. It would not be wrong to say that machine learning and especially deep learning techniques are “data-hungry”.
When it comes to Machine Learning, it is essential to remember this quote from Michelangelo, the Engineer & Poet from the Renaissance period:
“The sculpture is already complete within the marble block before I start my work. It is already there; I just have to chisel away the superfluous material.”
We can think of Machine Learning in the same way. The independent variables that impact the outcome of dependent variables are already there. They are waiting for us to help them reveal themselves. All we have to do is apply the right Machine Learning algorithms to the correct input variables.
The right amount of data can be thought of in two aspects:
A. Depth of data (Quantum of data in terms of the number of observations and how far back does the data go) and
B. The breadth of data (External Factors)
The Depth of Data
We will refer back to the comment from Prof. Yaser Abu-Mostafa from Caltech, who stated that as a rule of thumb, you need roughly ten times as many examples as there are degrees of freedom in your model. For the purpose of illustration, if we were trying to identify profitable customers for a grocery chain, our data may look like what is depicted in the table below:
 Sample Layout of Data Elements in a Hypothetical Dataset
The first thing to note is that any machine learning model would be interested only in the numerical columns. Thus the two name columns and the gender field, if not converted into numbers, would be of no interest. Intuitively, we know that gender could play an important role (so it should be converted to a numeric field) in the analysis and perhaps the name fields can be safely dropped.
For most of the 12 columns if we have enough data such that we can meet any one of the following statistical rules:
A. For these 12 columns, we would look at what the maximum values could be in each column. As an example for the Frequency of Purchase Columns, if we are going to be satisfied with a max count of recording a transaction a day then the number of observations should at least be 30 as that is the maximum number that the values in the column can hold. This approach would apply to all the columns.
Depending on how many sku's the store carries, the sample size can increase quite rapidly. A store with 5,000 sku’s would need 5,000 rows of data in the sample size.
B. A traditional statistical approach might suggest that a sample size be chosen on the basis of a specific confidence level. However, that estimate does not account for time duration and associated seasonality.
Grocery purchases have a short life cycle span with purchasers needing grocery items each week or two weeks. In such cases, we may need to add a qualifier to state that a minimum count of records are required for each week of a year to get a fuller picture.
The Breadth of Data
The following factors also impact the size of the basket and the groceries bought:
Weather
School Holidays and other Statutory Holidays
Special Occasions - Superbowl, Valentines Day etc.
Weekdays versus Weekends and other such factors
We can add most of these variables to the input data from third-party sources to get a better picture of what may be at play.
Gathering correct data is the core of every machine learning business application. Machine learning experts often say that “cleaner data” is better than big data. Cleaning your data means correcting the errors in the data. That means we also need to focus on the correct data because otherwise, it will be harder to yield insightful results. According to a survey in Forbes, data scientists spend 80% of their time on data cleaning. For example, there might be missing values in your data. You can either drop those values or replace them with the average of the known values.
3. Test different approaches for the input and the output with a few different algorithms.
We have seen there are many Machine Learning algorithms available for prediction. Each algorithm has its own advantages and disadvantages. Also, it’s not easy to select an algorithm based on the data available. We need to try different approaches and different algorithms to get the best-fit model.
Following up on the Michelangelo quote above, it is always good practice to check for a direct relationship between the variables and the outcome with two distinct viewpoints:
A. Single Variable to Output
Check for a direct relationship between the independent variables and the desired outcome.
In the case of this hypothetical grocery store, we would examine if each of the variables (apart from the first name and last name) directly impacts the frequency of purchase and the value of the basket size.
B. Multiple Variables to the Output
We would also combine multiple variables into a derived metric (with different weights) to uncover any linear/non-linear relationship.
When looking at the results of both single variables and multiple variables (derived metrics), we must pay attention to the adage of "correlation does not imply causation".
This saying in statistics is crucial in applying common sense to a statistical relationship. One of the best examples of this adage is the skirt length theory.
This theory was first suggested in 1925 by George Taylor of the Wharton School of Business. In the 1920s- the "Roaring Twenties"- the economic strength of the U.S. led to a period of sustained growth in personal wealth for most of the population. This, in turn, led to new ventures in all areas, including entertainment and fashion. Fashions that would have been socially scandalous a decade before, such as skirts that ended above the knees, were all the rage.
Upon the onset of the depression, the skirt lengths once again fell back to being below the knees. The trends were visible again in the 1980s as the stock market touched higher peaks with the accompaniment of Reaganomics. The stock market crash of 1987 again saw an inverse relationship between the markets and the length of the skirts.
Clearly, while there may be a statistical relationship between the two variables, there is no scientific relationship at play here.
When we select input variables, make sure the variables are relevant. Similar variables will cause duplication, and unrelated variables may add to the noise factor. Get active participation from the larger team that may have a different context of the business problem.
Much like picking the right variables is key, so is the correct algorithm. Based on the data available and the KPI set as the goal, the right algorithm needs to be matched to the proper KPI. Finding the right algorithm requires an experienced team and time for many hypotheses to be tested by them.
4. Move the algorithms instead of your data.
Usually, the dataset resides in a database somewhere (no pun intended). Users mostly import the data out of the database, run the algorithm on it, and export the data back to the database. This process takes a lot of time, maybe hours or even days.
The best approach towards this could be to run the algorithm inside the database or object storage. This approach is relatively faster, and data can be queried using SQL (Structured Query Language). We can connect many machine learning tools to relational databases, and we have free open source database tools like MySQL to perform the task.
The larger your dataset, the more time you will save by running your algorithm on the database directly.
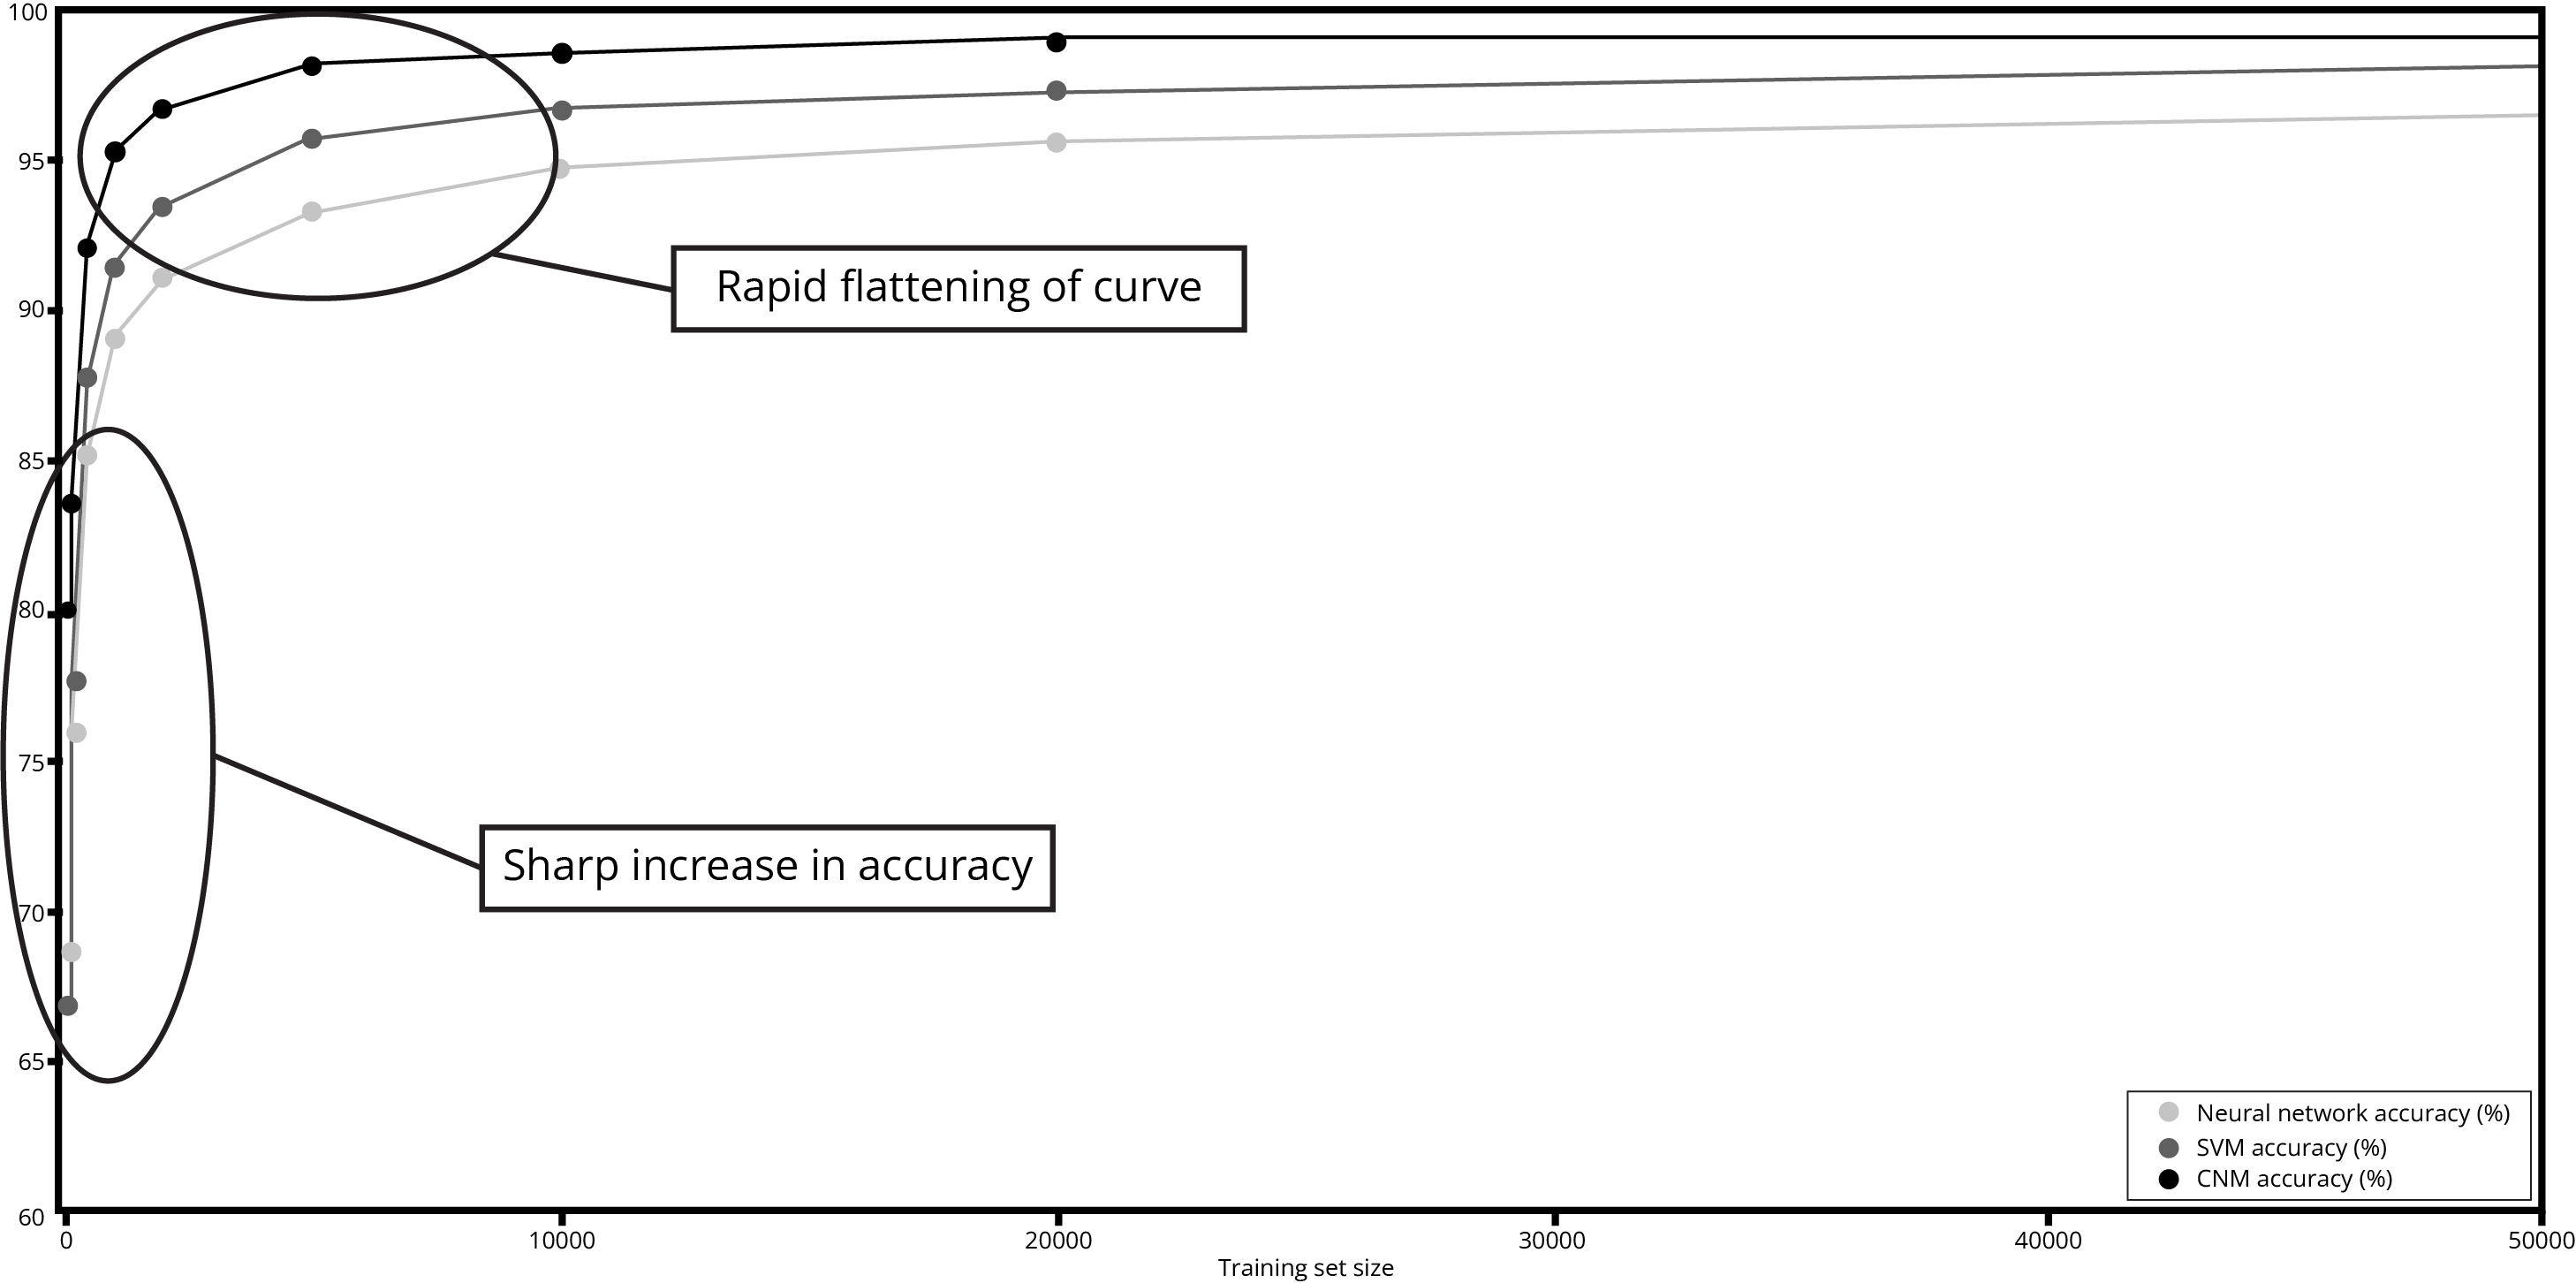
From the above image it is obvious that different models give different accuracy and generally generate high accuracy results if we increase data size. So, selecting the right machine Learning algorithm for our data is like a treasure hunt.
5. Test, Train, and then Test & Train some more.
The standard rule for training and testing is that you keep 70%-80% data for training and 30%-20% data for testing the algorithm. That’s a rule of thumb. Once you begin to see meaningful results, you can run the algorithm on some unrelated (but similar) open public datasets too as further validation.
When running an algorithm on the testing data, we need to ensure that:
The testing set is large enough to yield meaningful results.
The testing data has the same characteristics as that of the training set. It should act as a representative of the training set.
At this stage, the Data Scientists will also finetune the parameters of the algorithm to ensure a ‘best fit’. This is part science and part art. A Machine Learning algorithm that doesn’t overfit or underfit is desirable.
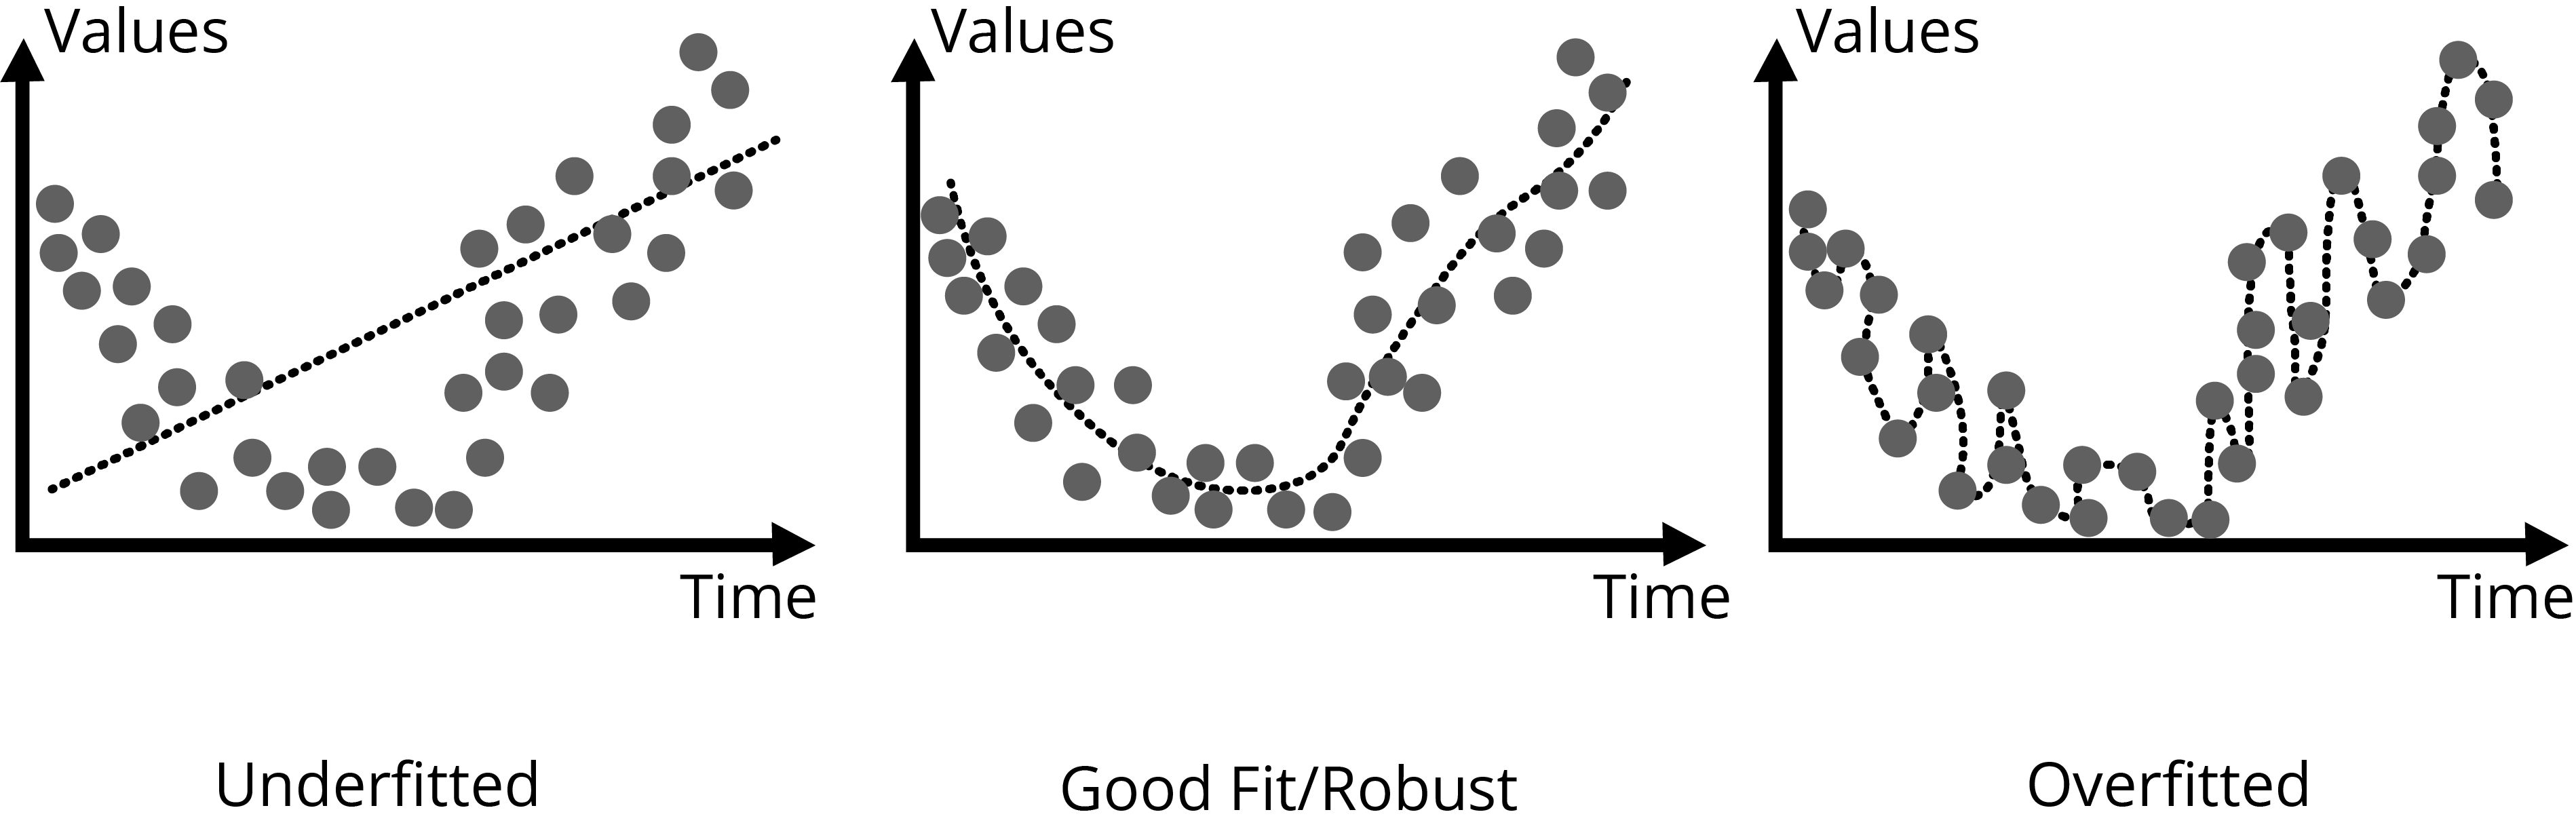 A Visual Representation of How data can ‘fit’ an Algorithm
An underfit visualization of results, is referred to as a set of results with a ‘high bias’. In the case of an overfitted model, where the algorithm covers every data point, there is a high probability that all noise and exceptional events are being accounted for. This does not indicate a high accuracy rate. It may indicate ‘high variance’.
Bias - refers to the accuracy of the algorithm.
Variance - refers to the size of the fluctuation of the output from the model.
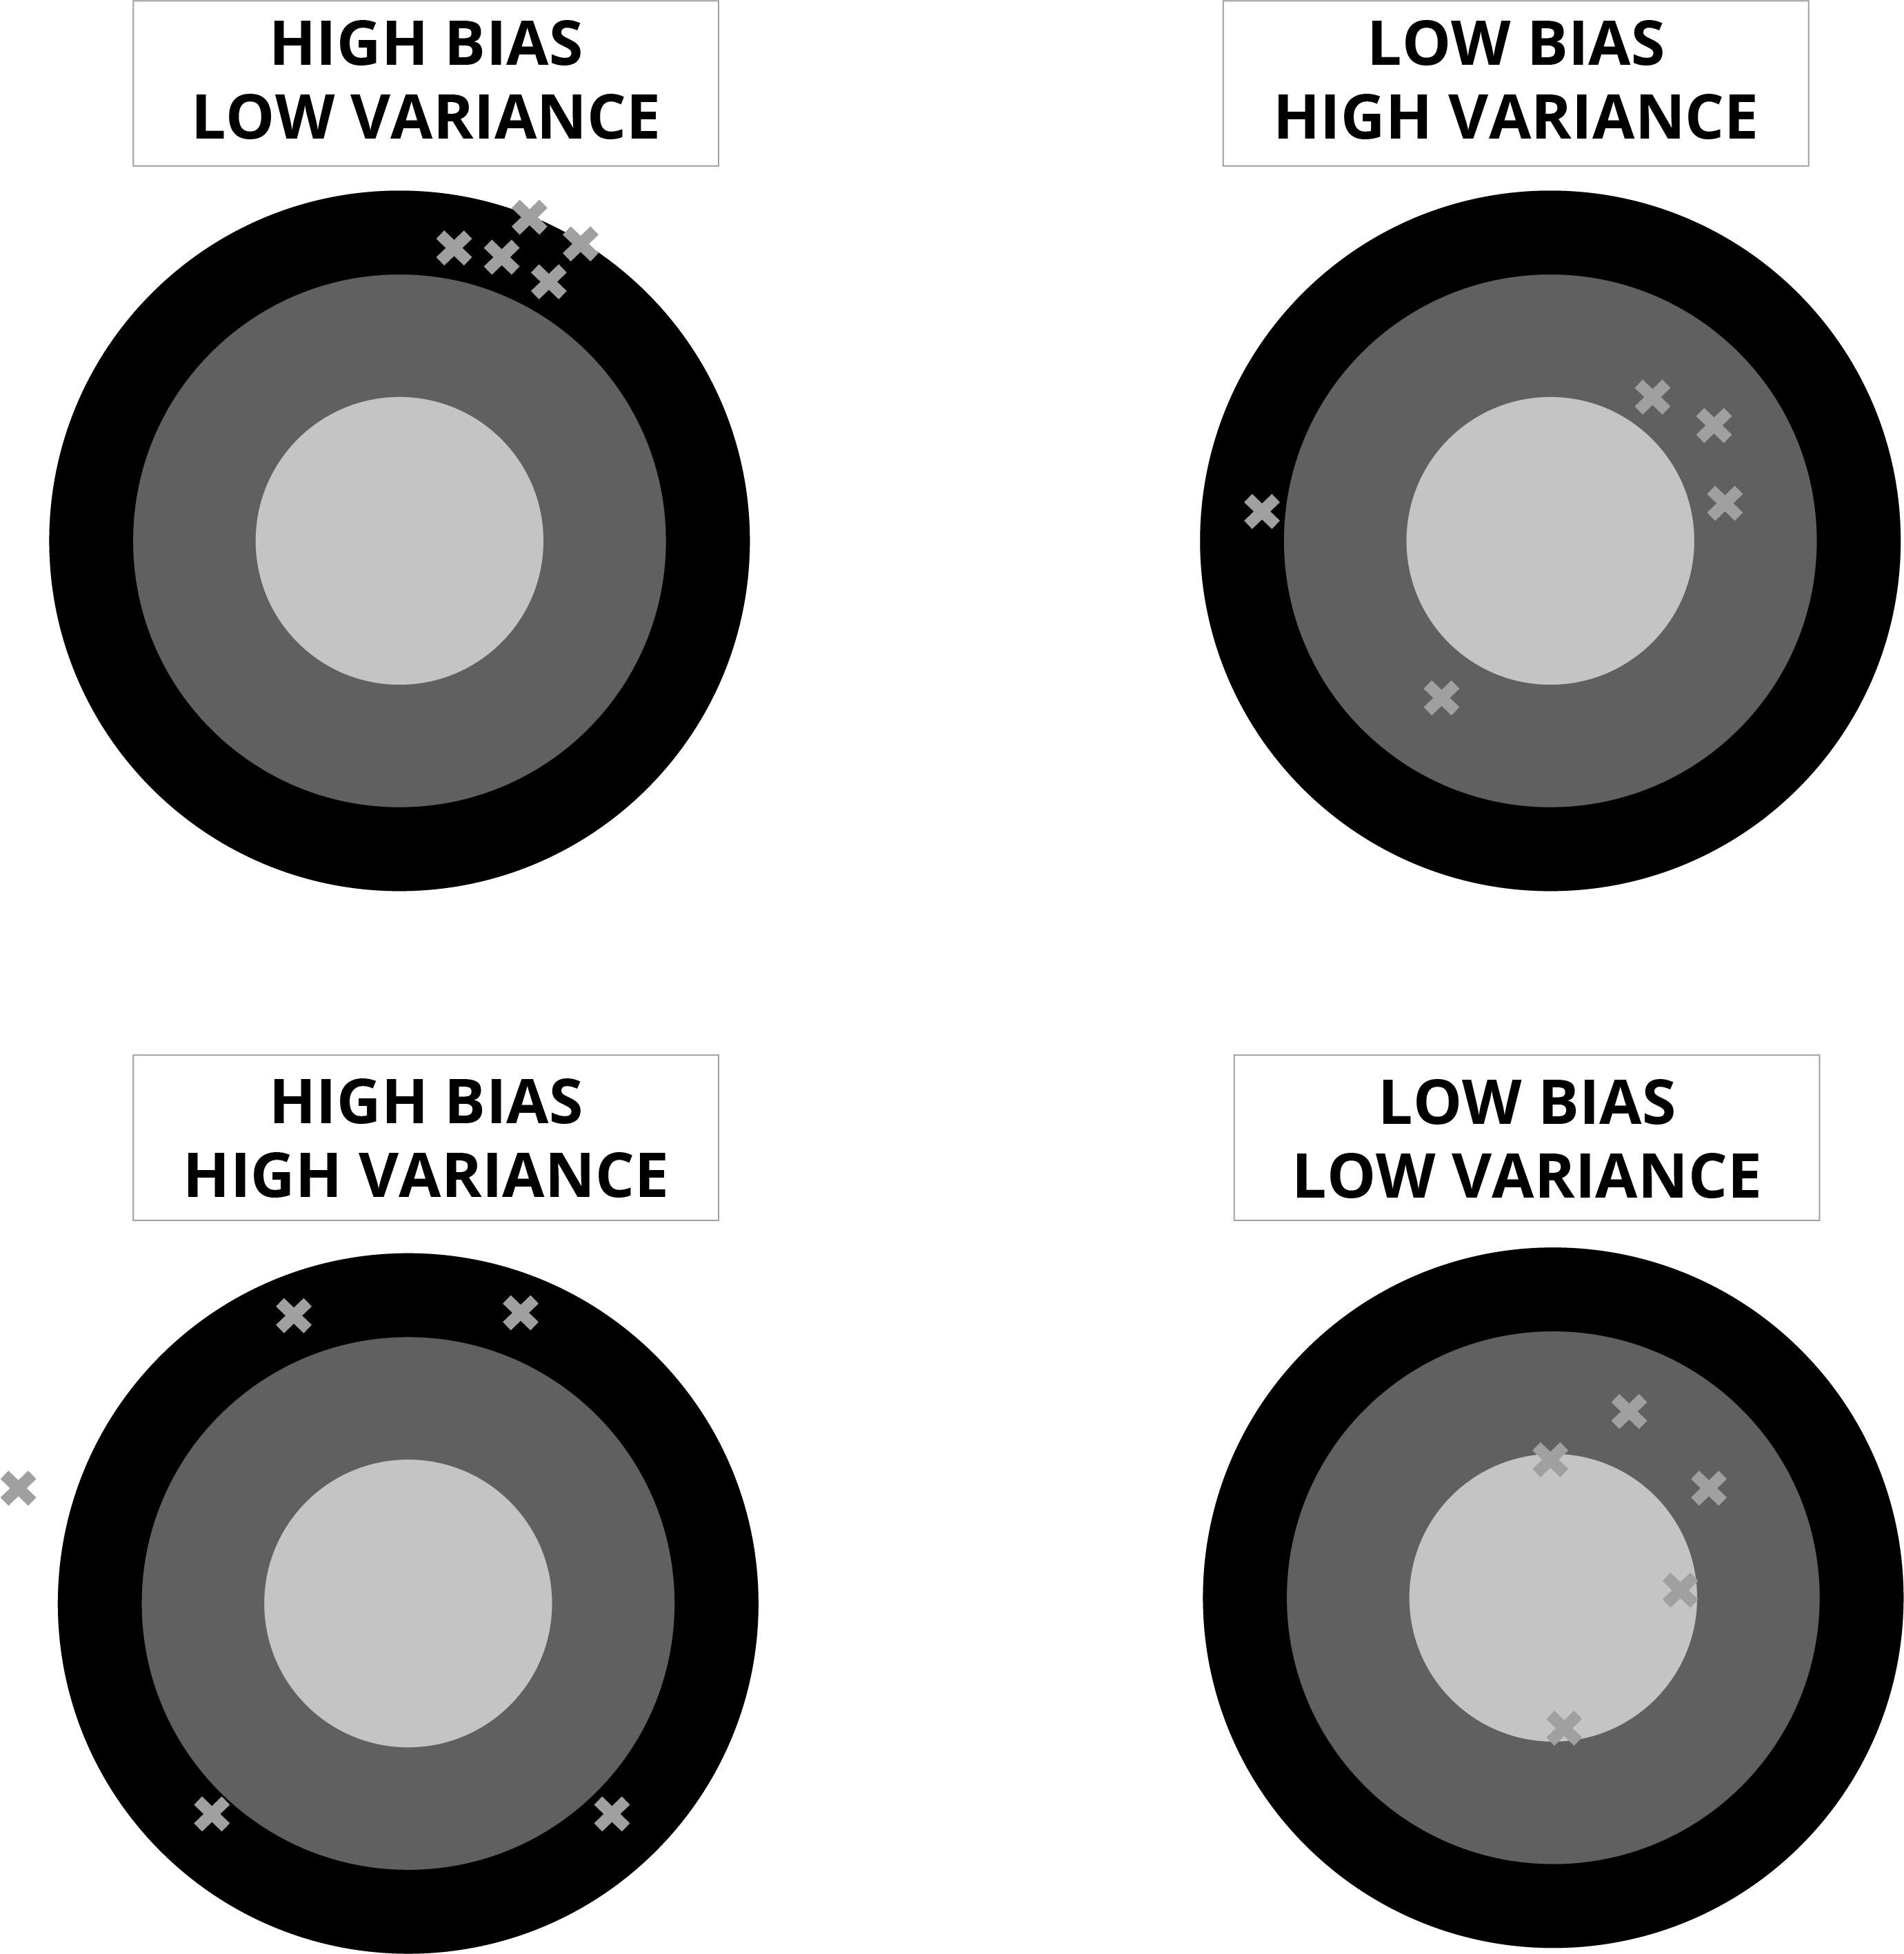
Finding the right fit when it comes to the data and the Machine Learning Model
The ultimate goal is to find a model that produces a ‘high bias’ and ‘low variance’.
In statistics and machine learning, the bias-variance tradeoff refers to the dilemma of accuracy (bias) and fluctuation (variance). Ideally, an algorithm should produce high bias and low variance. The bias-variance tradeoff is a central problem in supervised learning. Ideally, one wants to choose a model that both accurately captures the regularities in its training data, but also generalizes well to unseen data. Unfortunately, it is typically impossible to do both simultaneously.
6. Avoid data dropping while machine learning algorithms train.
The goal of machine learning algorithms is to develop a model that can predict future unseen instances. Most of the time, you may feel the need to “filter out” some data because it might become easier to explore and understand the model. But there’s a particular disadvantage linked to this practice. You might be missing out on a lot of valuable information that is not present in the rest of your data.
In our hypothetical grocery example, data during the Covid19 lockdown should be marked as such so that any analysis covering this period does not lead us down the wrong path.
But over a long period, you could benefit from comparing such data with other periods when similarly stressful situations might have existed in the past.
Remember to use data masking or data tokenization in case you don’t want to expose any personally identifiable information (PII).
7. Validate, Validate, Validate.
Cross-validation is usually suggested in evaluating machine learning models. While the algorithm works on the training set, it has to deal with an independent dataset in real life.
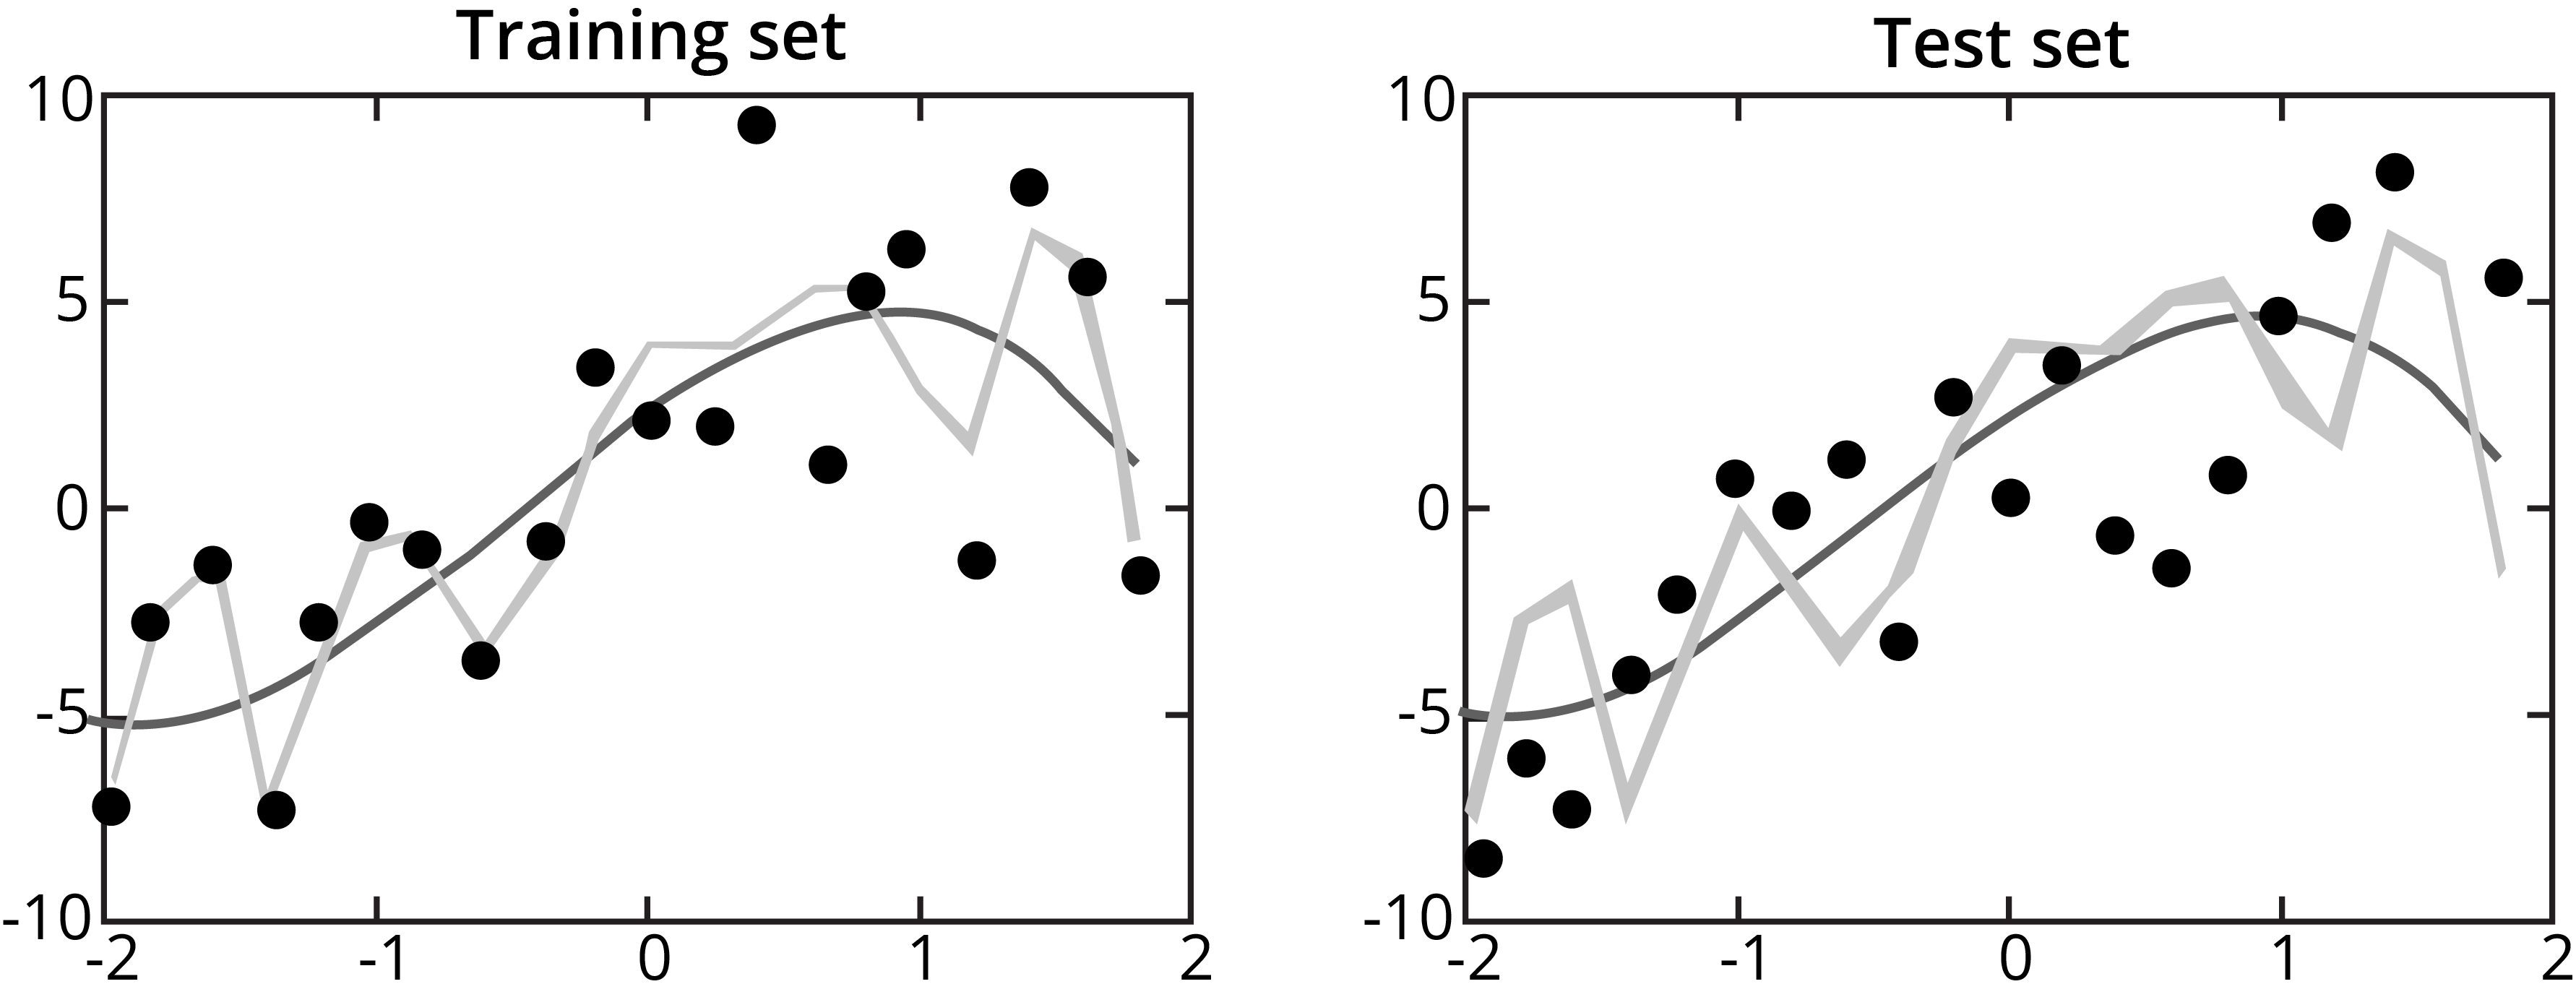 Training Data helps the Algorithm learn and adapt to the Test Data
A further manner of testing would be to apply the model on data outside the training set and the 20% example on data for different years, data from a smaller brand of grocery chain stores that the parent company may own. Lots of training datasets usually consist of corresponding test sets, which have instances labeled by hand, against which we can calculate the model’s performance. If a test set is not there for a given dataset, it can often be beneficial for a team to create one.